Completely NOT a random sample.
66 million and an ad placed on Facebook is pretty random.
1 Like
Not as much. It’s harder to lie on the phone.
Why?
…
1 Like
They self select. Not random.
DOes it make sense to you that of the 5M respondents, 23% of ALL of the hesitants were PhDs?
So what? Anybody that chooses to answer “self selects”.
The people who bother to answer those surveys, rather than scroll past are likely not a representative sample of anything.
1 Like
Definition: Random sampling is a part of the sampling technique in which each sample has an equal probability of being chosen .
Especially on the topic of vaccination on Facebook.
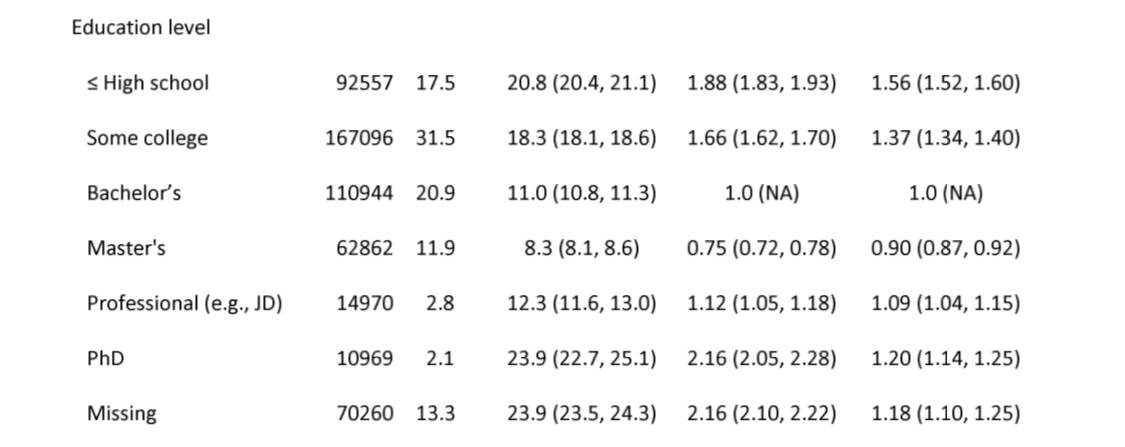
Interesting. The “PhD” group and “missing” group have the same reported hesitancy and relative risk and nearly identical adjusted relative risk despite there being a difference of nearly 60,000 respondents between the groups. It could be coincidence.
Coincidence wouldn’t make much sense though since an evenly distributed education level in the “missing group” would be expected to match the overall study hesitancy. It did not (17.1% overall versus 23.9% in missing group). You could do a t test to objectively show statistically significant similarity of the groups but when they’re identical it’s probably overkill. It would be nice to know how the study was formatted to see if there would be a reason for the two groups to have identical hesitancy numbers based on user error.
Then again, maybe PhDs are truly more hesitant.
How?
Does the phone zap you when you tell a lie?

2 Likes
This is where our dear CEC critics…who spend copious time on a CEC host forum…fall flat on their collective posteriors. All polls are a super soft science.
But totally inaccurate when it come to polling.
Allan
Not true.
Some polls are softer than others.
Allan
Based on?
66 million people.
Again, what’s wrong with facebook as a medium? You’re on it.
Not any more than any other means.
2 Likes
Actually I’m not.
Sure, sure.
