I am a housing bear, (and a stock bear, and bearish on a lot of things right now),
so it is tempting for me to point to the 9-percent, 3-month drop in median home prices
and declare “The housing collapse is upon us!!”
Still, I believe that right now the Case-Shiller index, which has dropped only 5% is probably a better reflection of most people’s situation.
Okay, so,for now Case-Shiller in, media price out.
What does Case-Shiller tell us?
Probably the most interesting thing is that, so far, the drop in home prices this time is faster-steeper (more violent) than the drop in home prices last time.
IOW So far, the rate-of decline is greater than the rate-of-decline last time.
If the current rate-of-decline continues for 5.75 years (and I doubt it will),
byt that measure the total decline in home prices would be something like 48.5% this time, (vs 27% last time.) Wow. ikes. Run for the hills and learn togrow your own wheat.
.
.
.
At some point in the past I decided the length of the green line below, (which is 2.5 years) is also very important and serves as a the best/only comparison we have.
I see no reason to change that now. So, it’s a thumbnail sketch, but in a dart-throwing sort of way, I can predict a total decline in home prices will actually be 15-20%.
Here is one measure that usually does not matter.
It usually does not matter because it usually does not last long.
The rate of change in home prices is declining at the fastest rate in modern history.
the slope of decline right now is greater than the slope of decline during the “housing” crisis of 2006-2008
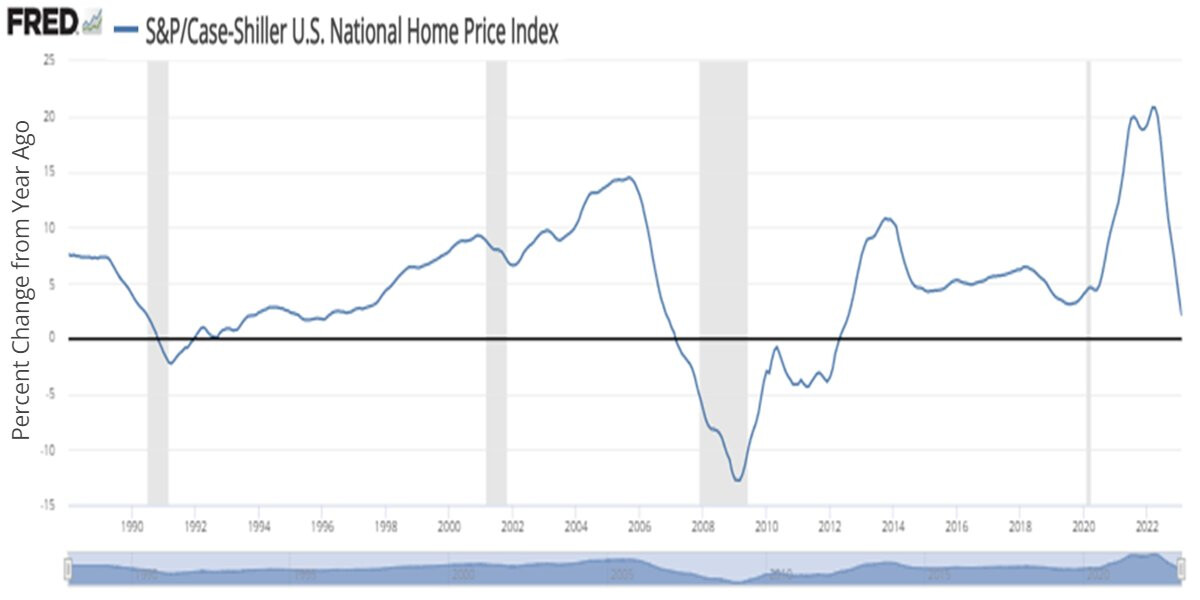
Chart below is not Case-Shiller (as normally presented)
Chart below is the Y-o-Y change in Case-Shiller.
If things continue at this rate we are all in very deep doo doo.
Same Y-o-Y rate of change information as above
presented with arrows.
Again, this measure is not used very often and will matter if and only if the current rate of change continues for a protracted time. That is not the most-likely scenario.
Well, I dunno that this chart is the BEST way to view the current situation, (I am still forecasting a correction not a crash) but this chart is accurate.
Home prices really did rise more and faster this time, than in the big big bubble circa 2010,
&
so far, for this tiny sliver of months, home prices really are falling faster than circa 2010
There is little incentive for any current home owner to sell their home right now. Locked in at ultra low interest rates and high home values.
Hence this market standoff we are in, the catalyst for a “crash” is not there. Current homeowners are not underwater and have been the least affected by rising costs due to their low cost mortgages.
That said, there is an interesting twist this time.
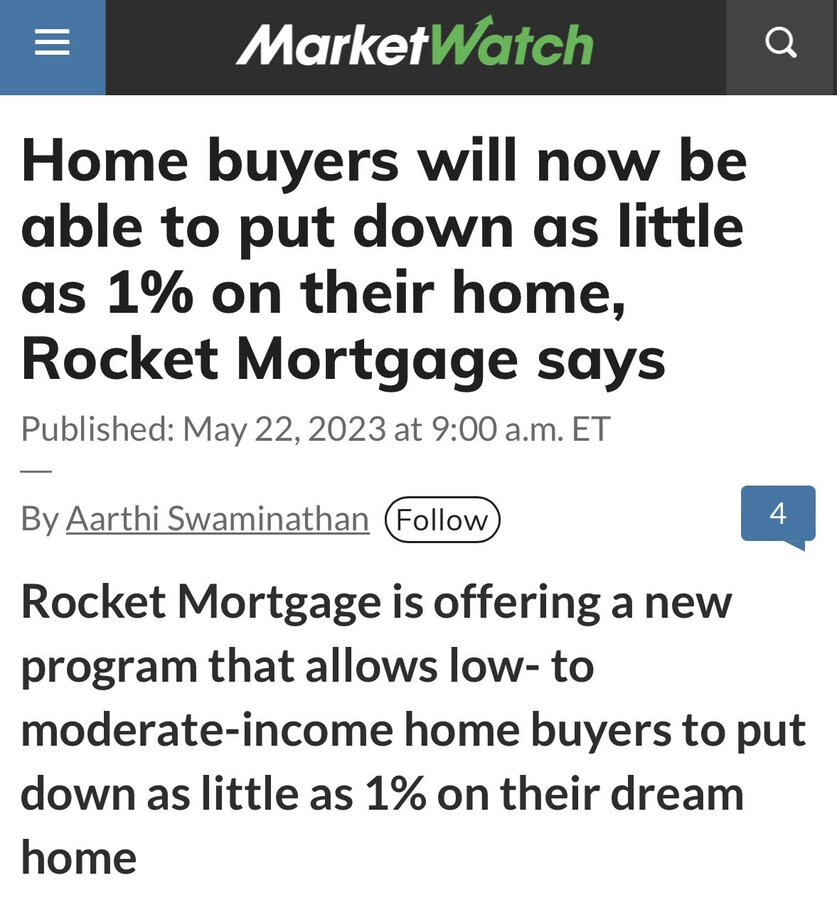
The investment real estate market (people flipping homes, people and corporations opening AirBnBs, people and corporations becoming long term landlords etc.) is very very different now from any other time in history.
If we put a Chinese wall around the investment real estate market, and examine it in isolation from say stocks and bonds, then every investor out there should, sell sell and run screaming for the exits.
This is a horrible time to buy investment property,
this is a horrible time to hold investment property
this is a very good time to sell one’s investment properties.
Pretty much the only rational reasons to hold an investment property now are variants “In my particular situation the alternatives are worse. What am I gonna do? Put cash in my mattress and wait it out?” (That is a real reason to hold btw. I chose snarky words, but the idea is a real one.)
Could be happy to hold.
OTPH the average home owner buys and sells every few years
Starter home, move-up home, change jobs home retirement home . . . 3-4 moves between age 25 and 65 are quite normal. People chose to do this. They chose it because they wanted to do it. Each move costs thousand of dollars. People willingingly spend thousand of dollars every few years to move.
Either
a) People suddenly (“magically”) stopped behaving they way they have behaved for a century
or
b) People are stuck They want something and under normal circumstances they would gladly pay thousands of dollars to get it, but now, the cost of achieving their wants is MUCH higher in the form of price of the next home, higher interest rates etc…
.
.
.
(If new car prices triple, and the int. rate of new car loans triple people will keep their old cars. That does not mean suddenly Americans dislike new cars.)
Depends on when you bought it, it’s a great time to hold investment properties if you locked in a low rate.
All of the investors that scooped up homes before the pandemic are sitting very pretty. Their payments are low, rent is high and home buying is frozen leading to more renters.
The ones that lost out were the flippers that came late to the party.
Especially given that investment properties have a premium attached to the rate.
Right now you can cash out
and receive a higher multiple to erent than at any time in the history of the Case-Shiller Index (laser targeted in this case a half century old index that measure only resale homes.)
Keep $X invested in retail real estate now
and you are keeping it invested at the lowest return in all modern history. There has never been a worse rate-of-return.
.
.
.
That said (and this is my snarkily-made point from above) if taking your equity from your rental property and investing it elsewhere, like stocks or bonds, makes you uncomfortable, then don’t do it. But know that you are holding at a very very bad time to hold because you are not comfortable investing elsewhere.
I should have clarified it depends the why behind an investment property it’s it’s for income and locked in a low rate this is an amazing time and it will only get better as rents will continue to rise.
Sure you could sell it, invest your funds in the market for max returns but property investments are typically made as long term investments.
As you might know real estate investors are a different breed it’s about owning an actual tangible item. They also tend to be more risk averse.